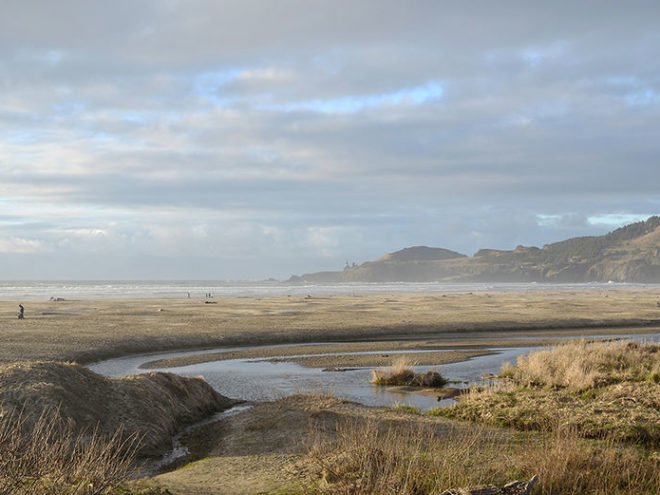
Results from a new analysis of 1,900 soil cores collected around the United States could bolster efforts to monitor and protect wetlands around the globe.
Tidal wetlands come in many forms, but they could be more alike below the surface than anyone realised. Whether it’s a mangrove forest in Florida, a freshwater swamp in Virginia or a saltwater marsh in Oregon, the amount of carbon locked in a soil sample from each of these coastal ecosystems is roughly the same.
That’s the surprising message from a new analysis of 1,900 soil cores collected around the United States during the past few decades. “In terms of carbon stocks, all tidal wetlands are very, very similar,” says Lisamarie Windham-Myers, an ecologist with the US Geological Survey (USGS) in Menlo Park, California, who is leading a 3-year, US$1.5-million assessment of coastal carbon funded by NASA. “The variability that everybody expected just doesn’t exist.”
The discovery could bolster efforts to assess and protect the world’s coastal wetlands. These ecosystems accumulate vast stocks of carbon that are released into the atmosphere when wetlands are destroyed. Development alters some 800,000 hectares of coastal wetlands around the world each year, sending roughly 500 million tonnes of carbon dioxide into the atmosphere — double the carbon emissions of Spain in 2016.
Blue carbon
Over the past decade, scientists and policymakers have pushed to protect the carbon stored in coastal wetlands, known as blue carbon. The goal is to address climate change while protecting ecosystems that sustain fisheries, improve water quality and protect coastlines against storms. But raising money to support such efforts often requires determining precisely how much carbon these ecosystems hold, and how it accumulates over time.
Windham-Myers’s team reanalysed raw data from 1,500 sediment cores collected over the past several decades, and 400 newer samples. The data showed a clear relationship: the density of soils decreased as the fraction of carbon in those soils increased, and vice versa. As a result, the amount of carbon in any given cubic metre of soil remained roughly the same, regardless of differences in vegetation, climate, topography or water chemistry across blue-carbon ecosystems.
“It’s almost like a universal constant,” says Stephen Crooks, an independent geomorphologist in San Francisco, California, who analysed blue-carbon stocks in the latest US inventory of greenhouse-gas emissions and sinks. That report, which the US Environmental Protection Agency released in April last year, found that the United States’ 3.8 million hectares of coastal wetlands soak up 8.1 million tonnes of CO2 each year.
Estimates from a century’s worth of soil surveys by the US Department of Agriculture (USDA) showed more variation, but those figures were based on data collected by people who were often thinking more about agriculture on land. In the Mississippi delta, for instance, many early measurements were limited to surface sediments that are rich in carbon, and estimates of the soil density below the surface may have been too high. As a result, Windham-Myers says, the USDA overestimated carbon stocks in the region.
Crooks says that if soil measurements from wetlands elsewhere agree with the US findings, global estimates of carbon stocks could improve. Windham-Myers and her colleagues recently examined data from coastal wetlands across Africa, and the results were consistent with the team’s analysis of cores from US tidal wetlands.
Soil sink
But understanding how much carbon is in the ground is just a prelude to determining the rate at which wetlands sequester carbon. That figure depends in part on local topography and the rate at which seas rise and create more space for carbon-rich sediments to accumulate. In addition, methane emissions vary widely depending on whether water in a wetland is salty, fresh or brackish. Similarly, understanding how much carbon enters the atmosphere when a wetland is drained for agriculture or other purposes requires a more detailed understanding of the soil make-up.
All of this information must be plugged into models to project how wetlands will evolve in the coming decades — and whether they will be able to keep pace with rapidly rising seas, says John Rybczyk, a wetlands ecologist at Western Washington University in Bellingham. His analysis of a 61-hectare marsh restoration project that was completed in Washington’s Puget Sound in 2012 found that the site would sequester an additional 5,660–13,200 tonnes of CO2 over the next 75–100 years.
That’s enough to fetch around $200,000 on voluntary carbon markets that allow companies to offset their emissions by funding conservation projects. “You aren’t going to change the carbon balance of the globe doing that, but you can use it as another tool to fund some of the restoration projects,” Rybczyk says.
Crooks hopes that providing better data on the carbon stored by wetlands will encourage governments to halt the destruction of these ecosystems — especially in places such as southeast Asia, where they are disappearing the fastest. And harnessing budding markets for carbon offsets could help to pay the bills for such conservation efforts, he adds.
“At the global level, it’s important that we find every mechanism that we can to offset our carbon emissions,” Crooks says. “This is one piece of the puzzle.”
This article was originally published on Nature: International Journal of Science.
Read more about carbon storage in Australian wetlands in this article: Wetland champions, or by visiting our Rivers of Carbon projects pages.
